
The occupational structure of Britain c.1379-1911
Home > The occupational structure of Britain c.1379-1911
In this blog post Leigh Shaw Taylor (University of Cambridge) presents some of the findings of the Occupational Structure of Britain c.1379-1911 project and highlights its public engagement website, www.economiespast.org which has been supported by the EHS Initiatives & Conference Fund.
—
The occupational structure of Britain c.1379-1911 research program was found by the late Tony Wrigley and myself around 2001. Today I direct the project with Professor Amy Erickson. The underlying aims of the project are (i) to reconstruct the occupational structure of the British economy in quantitative terms in as much detail as the surviving sources allow, as a way of providing a better understanding of the Industrial Revolution and the long-term economic development that preceded it (ii) to encourage and facilitate scholars in other countries to reconstruct historical occupational structures (iii) to collaborate with scholars elsewhere to put the findings on Britain in a comparative perspective.
We now have a very large volume of male occupational data for the period 1381-1911. At present we only have estimates of female occupational structure from the census period 1851-1911 because women’s occupations occur much less frequently in the historical record. Professor Amy Erickson is working on female occupations in the eighteenth and nineteenth centuries and Dr Xuesheng You, now at Cardiff, explored female occupational structure for 1851-1911 for his Cambridge Ph.D. thesis now largely published. For Scotland we are also currently restricted to the period 1851-1911 because we have not yet been successful in finding sources of occupational data for pre-census Scotland. If any reader is aware of suitable sources, we would be delighted to hear from them.
The figure below shows our estimates of male sectoral shares from 1381 to 2011. The 1381 estimates were made by Professor Richard Smith from the 1381 poll tax returns which consistently report occupations for a sample of vills, sufficient in number to produce robust estimates. We then have a gap in the estimates, indicated by the dashed lines which are speculative, from 1381-1601. From 1601-1801 the estimates, created by Dr Sebastian Keibek, derive from testamentary records (mainly wills and probate inventories). The data were collected by Keibek, Shaw-Taylor and Wrigley. The sources are heavily biased towards wealthier individuals but Keibek, in his Cambridge Ph.D. thesis, developed a compelling methodology for correcting the bias in probate documents. For c.1817 we used data on fathers’ occupation from baptism registers. It can be shown that baptism registers give very similar results to the 1841 census. From 1841-1911 we use the published census.
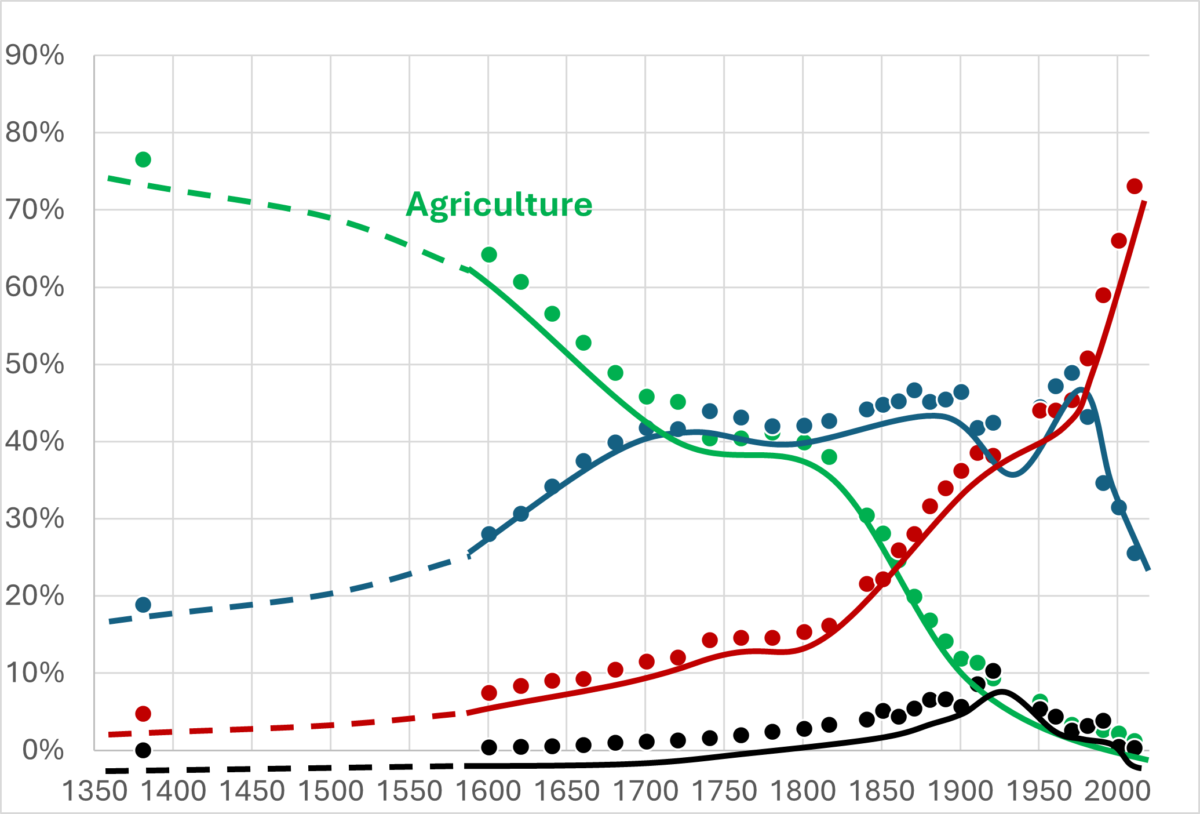
As can be seen in the graph, from 1601-1911 (and beyond), with the exception of the period from about 1730-1801, the share of the labour force in agriculture fell steadily. Over the period 1600-1851, before food imports came to form a major part of the diet, this is clear evidence of a sustained growth in agricultural productivity. Over the period 1600-1700 there was a continuous increase in the secondary sector (manufacturing and construction). Across the whole of the eighteenth and nineteenth centuries the share of the male labour force in manufacturing grew only very slightly. Thus, the structural shift of the labour force into the secondary sector, so long presumed to have occurred during the Industrial Revolution in the late eighteenth and early nineteenth century was almost completed two generations before the start of the Industrial Revolution. In the seventeenth century the labour force was shifting into low tech low productivity manufacturing and to increase manufacturing output required a higher and higher share of the labour force in manufacturing and construction. We can describe this as labour intensive industrialisation. After the middle of the eighteenth century more and more of manufacturing industry came to be based on new technologies with rapidly increasing labour productivity. This meant that manufacturing output could grow increasingly rapidly without requiring an ever-higher share of the labour force. We can describe this as technologically intensive industrialisation. One implication of our new male data, when integrated with estimates of female occupational structure, is that the annual rate of labour productivity growth in manufacturing during the Industrial Revolution was twice the rate estimated by the late Nick Crafts and by Broadberry et al. (2015). The knock-on implication of this finding is that technological change was much more pervasive than the national accounts literature currently suggests. The tertiary sector (services) also grew steadily across the eighteenth century and then rapidly in the nineteenth century. In fact, the key structural shift during the Industrial Revolution was from agriculture into services. The tertiary sector, with some exceptions, has not be accorded a central place in the historiography of the Industrial Revolution but was clearly of fundamental importance.
We currently lack estimates between 1381 and 1600, but change was clearly substantial since the secondary share of employment in 1600 was about twice the 1381 figure. We now have a very large volume of male data for the period 1415 -1596 but are not yet in a position to produce reliable estimates from it. Nevertheless, there is overwhelming evidence in the historiography that there was very little economic development in the fifteenth century, probably not much in the first half of the sixteenth century and overwhelming evidence of major economic development in the second half of the sixteenth century. It is therefore likely that structural change in the second half of the sixteenth century was similar to that in the seventeenth century and may have been significantly faster.
The three figures which follow show the average percentage increases in each county of the share of the male labour force in the secondary sector. Figure 2 shows that virtually all counties in England and Wales industrialised during the seventeenth century with Norfolk industrialising fastest due to the success of its wool (worsted) textile industry. By 1700 Norfolk was the most industrial county in England and Wales. The strong growth of the future industrial region in North-West England, and around Birmingham, is already apparent.
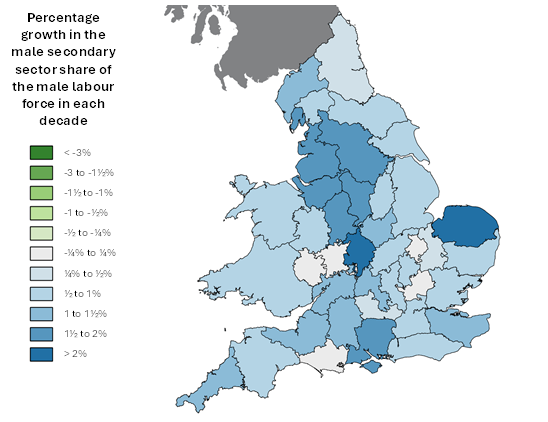
Figure 3 shows change between 1701 and 1761. In this period there were profoundly divergent patterns. Large parts of the country de-industrialised which, was largely driven by the decline of many regional textile industries. Other parts of the country continued to industrialise, not least Lancashire and the West Riding where the textile industry was burgeoning. Norfolk went into substantial decline in this period as its textile industry collapsed. Devon, also an old wool textile county, appears to have industrialised. This is probably misleading and an artifact of there being very limited data for Devon, as a result of the Luftwaffe bombing Exeter in 1942, which led to the incineration of most of the probate documents.
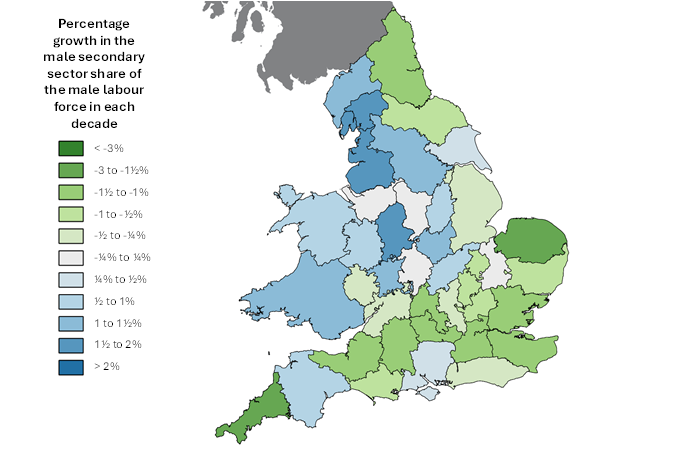
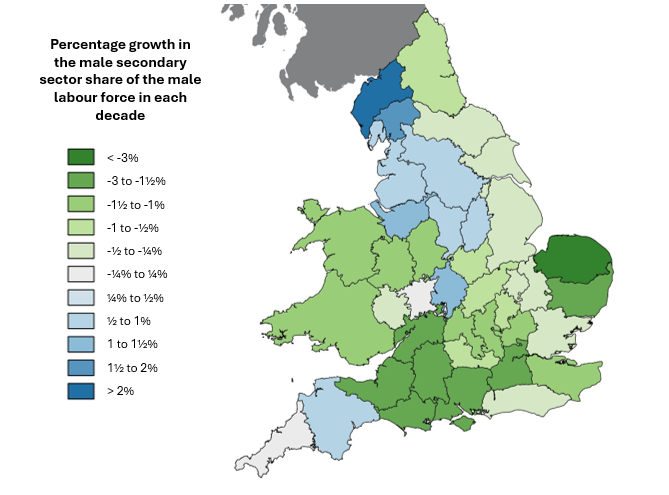
Figure 4 shows change between 1761 and 1817. As can be seen during the Industrial Revolution most counties were in fact de-industrialising. The Industrial North-West and the Birmingham area industrialised further. Again, the apparent industrialisation of Devon should be disregarded.
So, the absence of growth in the share of the male labour force in the secondary sector during the Industrial Revolution, masks dramatic change at the county level. This would be more dramatic still if the data were mapped at a more spatially disaggregated level because the industrial districts covered only a proportion of the counties in which they were located. In the same period county population growth in the industrial counties, and in London was very rapid while the predominantly agricultural and deindustrialising counties grew much more slowly. So, the contrast between the growth of industry in the manufacturing counties and the increasingly agricultural counties in the rest of the country was greater than is suggested by figures one to three. The result of these twin changes was that between 1701 and 1817 there was a profound spatial restructuring of manufacturing industry. Such a large and rapid change in economic geography was unprecedented in national history and had probably never occurred anywhere else in the world. A key causal factor in this development was the presence or absence of coal with industry concentrating on the coalfields from the late seventeenth century all the way through to the nineteenth century.
Most of our data can be disaggregated down to the level of the individual parish and disaggregated to individual occupational groups. At the EHS annual conference in 2024 we launched a public engagement website, www.economiespast.org which allows users to explore maps of changing occupational structure from 1600-1911 with 2011 for comparison. From 1601-1817 the data are for adult males only. From 1851-1911 the maps show both female employment and child employment. The site is aimed partly at schools, partly at university students and also at the wider general public and colleagues may find it useful for teaching purposes. It may also have value as a research tool.
I have generously been awarded a £5,000 Initiative and Conference Fund grant by the Society to improve the look and feel of the site and hope to have this work completed in the next six months. Subject to a further funding application we hope to enhance the functionality of the site after that.
The research underlying this project was generously funded by the ESRC, the Leverhulme Trust, the British Academy and the Isaac Newton Trust Cambridge. For further details of our findings, see Shaw-Taylor, L., ‘The occupational structure of Britain, c.1379-1911: An overview of the findings and where to find them’, forthcoming in Local Population Studies. We expect to publish: Saito, O, Shaw-Taylor, L., Occupational structure, industrialisation and economic growth in a comparative perspective, probably in early 2027. The book examines how occupational structure has changed during the transition to modern economic growth for 16 countries and will be accompanied by an online data appendix.
To contact the author:
Leigh Shaw-Taylor
lmws2@cam.ac.uk
Cambridge Group for the History of Population and Social Structure, Faculty of History, University of Cambridge
